MindFusion.Charting for WPFЮЊПЊЗЂШЫдБЬсЙЉСЫЖржжГЃгУЕФЭМБэРраЭЃЌПЩПьЫйДДНЈЧПДѓЕФЪ§ОнЭМБэгІгУГЬађЃЌЪЕЪБЭМБэдкЪЕМЪгІгУжаЪЧЯрЕБЙуЗКЃЌВЂЧвЫљДІРэЕФЪ§ОнСПвВЪЧОоДѓЕФЃЌMindFusion.Charting for WPFЬсЙЉСЫвЛИіЬиЪтЕФПтЃЌзЈУХгУгкДІРэетжжРраЭЕФЭМБэЃЌЯТУцдлУЧОЭМђЕЅНщЩмШчКЮвЛВНвЛВНДДНЈЪЕЪБЭМБэЃК
1.ГѕЪМЛЏПиМўЃЌАбRealTimeChartЭМБэДгVisual StudioЙЄОпЯфжаЭЯзЇЕНWPFДАЬхЩЯЃЌШЛКѓЛсЩњГЩЯТУцЕФДњТы
<my:RealTimeChart Margin="12" Name="realTimeChart1" />
2.дкКѓЬЈДДНЈВЂЩшжУЭМБэЕФXжс
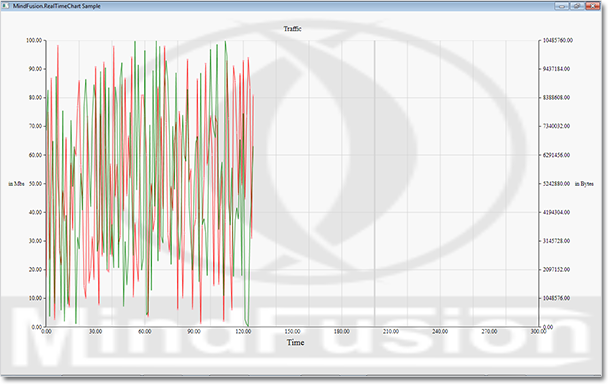
chart1.XAxis.Length = 300;
chart1.XAxis.LabelOrigin = 0;
chart1.XAxis.Origin = 0;
chart1.XAxis.Interval = 30;
chart1.XAxis.Title = "Time";
chart1.XAxis.TitleFontSize = 18.0;
chart1.XAxis.PinLabels = false;
3.ДДНЈYжсЃЌетРяВЩгУСЫЖрYжс
Axis axis = new Axis();
axis.Origin = 0;
axis.Length = 100;
axis.Interval = 10;
axis.Title = "in Mbs";
axis.TitleRotationAngle = 0.0;
axis.TickLength = 5;
realTimeChart.YAxisCollection.Add(axis);
Axis axis2 = new Axis();
axis2.Origin = 0;
axis2.Length = 10485760;
axis2.Interval = 1048576;
axis2.Title = "in Bytes";
axis2.TitleRotationAngle = 0.0;
axis2.TickLength = 5;
axis2.LabelHorizontalAlignment = HorizontalAlignment.Right;
realTimeChart.Y2AxisCollection.Add(axis2);
4.ЬэМгЭМБэЪ§ОнађСа
//series bound to the left Y-axis
Series series1 = new Series(realTimeChart.YAxisCollection[0])
{
Stroke = new SolidColorBrush(Colors.Red),
Title = "Server 1",
ScatterType = ScatterType.Diamond,
ScatterStroke = new SolidColorBrush(Colors.Pink),
TitleFontFamily = new FontFamily("Verdana"),
TitleFontSize = 12
};
//series bound to the right Y-axis
Series series2 = new Series(realTimeChart.Y2AxisCollection[0])
{
Stroke = new SolidColorBrush(Colors.Green),
Fill = Brushes.Green,
Title = "Server 2",
ScatterType = ScatterType.None,
TitleFontFamily = new FontFamily("Verdana"),
TitleFontSize = 12
};
realTimeChart.SeriesCollection.Add(series1);
realTimeChart.SeriesCollection.Add(series2);
5. ЮЊЪ§ОнЭМБэађСаЩшжУЪ§Он
series1.Data.Add(new Point(x1, y1));
series2.Data.Add(new Point(x2, y2));
//Update the chart
realTimeChart.Commit();
6. ЩшжУЭМБэЕФБГОА
<Grid.Background>
<ImageBrush ImageSource="mf_logo.png" Opacity="0.1"/>
</Grid.Background>
<my:RealTimeChart Margin="12" Name="realTimeChart" Background="Transparent"/>
7.дЫааГЬађЃЌаЇЙћШчЯТ