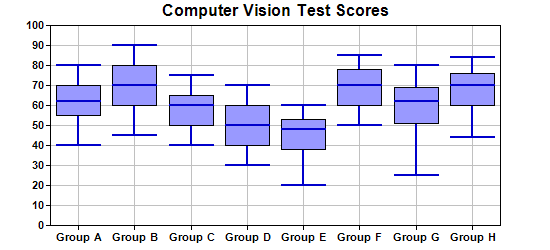
箱形图又称为盒须图、盒式图或箱线图,是一种用作显示一组数据分散情况资料的统计图。因形状如箱子而得名。在各种领域也经常被使用,常见于品质管理。箱形图提供了一种只用5个点对数据集做简单总结的方式。这5个点包括中点、Q1、Q3、分部状态的高位和低位。箱形图很形象的分为中心、延伸以及分部状态的全部范围。
ChartDirector图表控件可以快速帮助开发人员在ASP.NET以及.NET桌面应用程序中快速创建箱形图,以及对箱形图进行各种设置,下面的代码描述了如何创建箱形图,开发人员如果对该产品感兴趣可以从
控件中国网上下载该产品的最新试用版进行产品的相关功能测试,
ChartDirector图表控件不仅提供了详细的帮助文档还提供了大量的事例。
在Asp.NET下创建箱形图:
<%@ Page Language="C#" Debug="true" %>
<%@ Register TagPrefix="chart" Namespace="
ChartDirector" Assembly="netchartdir" %>
<!DOCTYPE html>
<script runat="server">
//
// Page Load event handler
//
protected void Page_Load(object sender, EventArgs e)
{
// Sample data for the Box-Whisker chart. Represents the minimum, 1st quartile, medium, 3rd
// quartile and maximum values of some quantities
double[] Q0Data = {40, 45, 40, 30, 20, 50, 25, 44};
double[] Q1Data = {55, 60, 50, 40, 38, 60, 51, 60};
double[] Q2Data = {62, 70, 60, 50, 48, 70, 62, 70};
double[] Q3Data = {70, 80, 65, 60, 53, 78, 69, 76};
double[] Q4Data = {80, 90, 75, 70, 60, 85, 80, 84};
// The labels for the chart
string[] labels = {"Group A", "Group B", "Group C", "Group D", "Group E", "Group F", "Group G",
"Group H"};
// Create a XYChart object of size 550 x 250 pixels
XYChart c = new XYChart(550, 250);
// Set the plotarea at (50, 25) and of size 450 x 200 pixels. Enable both horizontal and
// vertical grids by setting their colors to grey (0xc0c0c0)
c.setPlotArea(50, 25, 450, 200).setGridColor(0xc0c0c0, 0xc0c0c0);
// Add a title to the chart
c.addTitle("Computer Vision Test Scores");
// Set the labels on the x axis and the font to Arial Bold
c.xAxis().setLabels(labels).setFontStyle("Arial Bold");
// Set the font for the y axis labels to Arial Bold
c.yAxis().setLabelStyle("Arial Bold");
// Add a Box Whisker layer using light blue 0x9999ff as the fill color and blue (0xcc) as the
// line color. Set the line width to 2 pixels
c.addBoxWhiskerLayer(Q3Data, Q1Data, Q4Data, Q0Data, Q2Data, 0x9999ff, 0x0000cc).setLineWidth(2)
;
// Output the chart
WebChartViewer1.Image = c.makeWebImage(Chart.PNG);
// Include tool tip for the chart
WebChartViewer1.ImageMap = c.getHTMLImageMap("", "",
"title='{xLabel}: min/med/max = {min}/{med}/{max}\nInter-quartile range: {bottom} to {top}'"
);
}
</script>
<html>
<body>
<chart:WebChartViewer id="WebChartViewer1" runat="server" />
</body>
</html>
在C#桌面应用程序中创建箱形图:
using System;
namespace CSharpChartExplorer
{
public class boxwhisker : DemoModule
{
//Name of demo module
public string getName() { return "Box-Whisker Chart (1)"; }
//Number of charts produced in this demo module
public int getNoOfCharts() { return 1; }
//Main code for creating chart.
//Note: the argument chartIndex is unused because this demo only has 1 chart.
public void createChart(WinChartViewer viewer, int chartIndex)
{
// Sample data for the Box-Whisker chart. Represents the minimum, 1st quartile, medium,
// 3rd quartile and maximum values of some quantities
double[] Q0Data = {40, 45, 40, 30, 20, 50, 25, 44};
double[] Q1Data = {55, 60, 50, 40, 38, 60, 51, 60};
double[] Q2Data = {62, 70, 60, 50, 48, 70, 62, 70};
double[] Q3Data = {70, 80, 65, 60, 53, 78, 69, 76};
double[] Q4Data = {80, 90, 75, 70, 60, 85, 80, 84};
// The labels for the chart
string[] labels = {"Group A", "Group B", "Group C", "Group D", "Group E", "Group F",
"Group G", "Group H"};
// Create a XYChart object of size 550 x 250 pixels
XYChart c = new XYChart(550, 250);
// Set the plotarea at (50, 25) and of size 450 x 200 pixels. Enable both horizontal and
// vertical grids by setting their colors to grey (0xc0c0c0)
c.setPlotArea(50, 25, 450, 200).setGridColor(0xc0c0c0, 0xc0c0c0);
// Add a title to the chart
c.addTitle("Computer Vision Test Scores");
// Set the labels on the x axis and the font to Arial Bold
c.xAxis().setLabels(labels).setFontStyle("Arial Bold");
// Set the font for the y axis labels to Arial Bold
c.yAxis().setLabelStyle("Arial Bold");
// Add a Box Whisker layer using light blue 0x9999ff as the fill color and blue (0xcc)
// as the line color. Set the line width to 2 pixels
c.addBoxWhiskerLayer(Q3Data, Q1Data, Q4Data, Q0Data, Q2Data, 0x9999ff, 0x0000cc
).setLineWidth(2);
// Output the chart
viewer.Chart = c;
//include tool tip for the chart
viewer.ImageMap = c.getHTMLImageMap("clickable", "",
"title='{xLabel}: min/med/max = {min}/{med}/{max}\nInter-quartile range: " +
"{bottom} to {top}'");
}
}
}