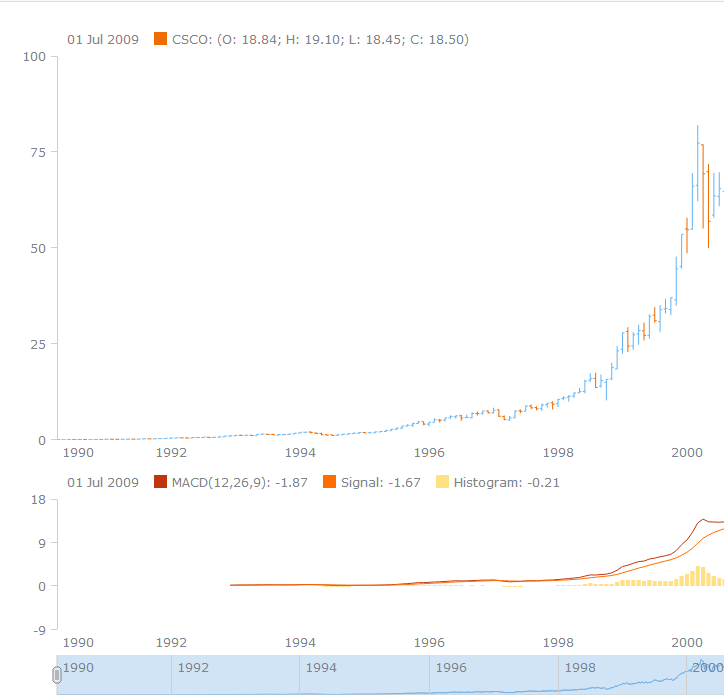
MACD称为指数平滑异同平均线,是从双指数移动平均线发展而来的,由快的指数移动平均线(EMA12)减去慢的指数移动平均线(EMA26)得到快线DIF,再用2×(快线DIF-DIF的9日加权移动均线DEA)得到MACD柱。MACD的意义和双移动平均线基本相同,即由快、慢均线的离散、聚合表征当前的多空状态和股价可能的发展变化趋势,但阅读起来更方便。当MACD从负数转向正数,是买的信号。当MACD从正数转向负数,是卖的信号。当MACD以大角度变化,表示快的移动平均线和慢的移动平均线的差距非常迅速的拉开,代表了一个市场大趋势的转变。
AnyStock是一款基于HTML5下的JavaScript金融图表控件,可以帮助开发人员在WEB下绘制各种常用的金融图表,这篇文章主要介绍怎么利用
AnyStock为金融图表添加常用的MACD技术指示器,具体可以参考下面的部分代码:
<html>
<head>
<script src="http://cdn.
AnyChart.com/js/7.10.1/
AnyChart-bundle.min.js"></script>
<script src="//cdn.
AnyChart.com/csv-data/csco-daily.js"></script>
<link rel="stylesheet" href="https://cdn.
AnyChart.com/css/latest/
AnyChart-ui.min.css" />
<style>
html, body, #container {
width: 100%;
height: 100%;
margin: 0;
padding: 0;
}
</style>
</head>
<body>
<div id="container"></div>
<script>
// The data used in this sample can be obtained from the CDN
// http://cdn.
AnyChart.com/csv-data/csco-daily.js
// create data table on loaded data
dataTable.addData(get_csco_daily_data());
// map loaded data for the ohlc series
var mapping = dataTable.mapAs();
mapping.addField('open', 1, 'first');
mapping.addField('high', 2, 'max');
mapping.addField('low', 3, 'min');
mapping.addField('close', 4, 'last');
mapping.addField('value', 4, 'close');
// create stock chart
// create the first plot on the chart
var plot = chart.plot(0);
// create line series
var ohlcSeries = plot.ohlc(mapping);
ohlcSeries.name('CSCO');
// create the second plot on the chart
var secondPlot = chart.plot(1);
secondPlot.height('30%');
// create MACD indicator with fast period 12, slow period 26 and signal period 9
var macd = secondPlot.macd(mapping, 12, 26, 9);
macd.macdSeries().stroke('#bf360c');
macd.signalSeries().stroke('#ff6d00');
macd.histogramSeries().fill('#ffe082');
// create scroller series with mapped data
chart.scroller().line(mapping);
// set container id for the chart
chart.container('container');
// initiate chart drawing
chart.draw();
});
</script>
</body>
</html>