ChartDirector是一款多功能多平台下的综合性图表控件,不仅支持的图表种类众多,而且支持的开发语言与平台也相当多,还可以同时用于桌面应用程序和Web应用中,在使用
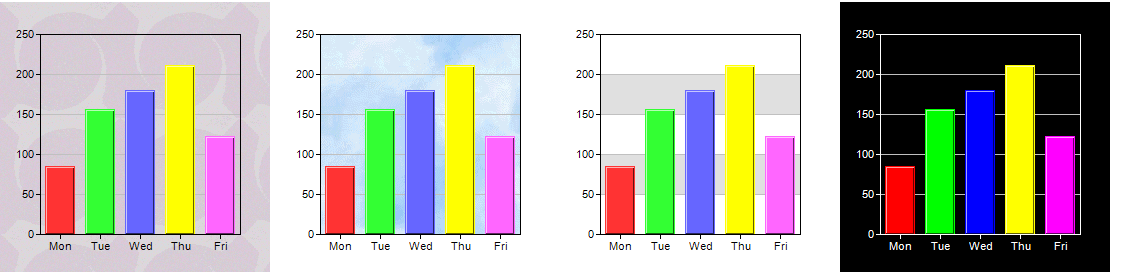
ChartDirector时经常需要设置图表的背景色,一般情况下图表的背景分为图表绘制区域的背景以及整个图表面板的背景,控件为这两个区域都提供了API进行设置,在设置背景时可以选择漂亮的图片作为背景也可以直接设置各种背景颜色,具体的用法可以参考下面的部分代码:
using System;
namespace CSharpChartExplorer
{
public class background : DemoModule
{
//Name of demo module
public string getName() { return "Background and Wallpaper"; }
//Number of charts produced in this demo module
public int getNoOfCharts() { return 4; }
//Main code for creating charts
public void createChart(WinChartViewer viewer, int chartIndex)
{
// The data for the chart
double[] data = {85, 156, 179.5, 211, 123};
string[] labels = {"Mon", "Tue", "Wed", "Thu", "Fri"};
// Create a XYChart object of size 270 x 270 pixels
XYChart c = new XYChart(270, 270);
// Set the plot area at (40, 32) and of size 200 x 200 pixels
PlotArea plotarea = c.setPlotArea(40, 32, 200, 200);
// Set the background style based on the input parameter
if (chartIndex == 0) {
// Has wallpaper image
c.setWallpaper("tile.gif");
} else if (chartIndex == 1) {
// Use a background image as the plot area background
plotarea.setBackground2("bg.png");
} else if (chartIndex == 2) {
// Use white (0xffffff) and grey (0xe0e0e0) as two alternate plotarea background
// colors
plotarea.setBackground(0xffffff, 0xe0e0e0);
} else {
// Use a dark background palette
c.setColors(Chart.whiteOnBlackPalette);
}
// Set the labels on the x axis
c.xAxis().setLabels(labels);
// Add a color bar layer using the given data. Use a 1 pixel 3D border for the bars.
c.addBarLayer3(data).setBorderColor(-1, 1);
// Output the chart
viewer.Chart = c;
//include tool tip for the chart
viewer.ImageMap = c.getHTMLImageMap("clickable", "",
"title='Revenue for {xLabel}: US${value}K'");
}
}
}